Category: USM (Page 1 of 2)

Alienvault: Working with Decoders and Rules

When we started out with Alienvault years ago, they were just a smallish, start up company and we worked directly almost with the engineers and sales team in Cork. Of course, a lot has changed since AT&T took over, but during the early days, there were a lot of knowledge and mindshare done directly between us and them. So much so that if you were to check their partner site, they still list us as the only Malaysian company as their reseller, due to the early days of listing. What attracted us to the product was that we could lift the hood and see what was underneath. Alienvault (or OSSIM) was previously a hodgepodge of many working parts that were glued together and somehow made to work. The agent was a product called OSSEC, which is an open-source HIDS. The IDS is Suricata/Snort and if you look closely at the availability tool, you would see the backend is a Nagios running. NFSen is used for their netflow data display, and PRADS for their asset discovery. OPENVAS is their vulnerability scanner and best of all, they allow you to jailbreak the system and go into the OS itself and do what you need to do. In fact, most of the time, we are more comfortable on the command line than through the actual UI itself.

The history aside, the downside of adding in these different applications and getting them all to play nice together, is that you would have to understand the interworkings of these pieces.

For instance, if you were to send logs via Syslog to Alienvault, you would have to know that the daemon rsyslog (not an Alienvault product) is the one being used to receive these logs. If you were to use the agent, then the application receiving these logs is different – it’s the OSSEC server that receives it. So it depends how logs come in, and from there you can decide what you wish to do with it.

The challenge is oftentimes to filter and ‘massage’ the logs when it hits Alienvault. There are a few approaches to this:

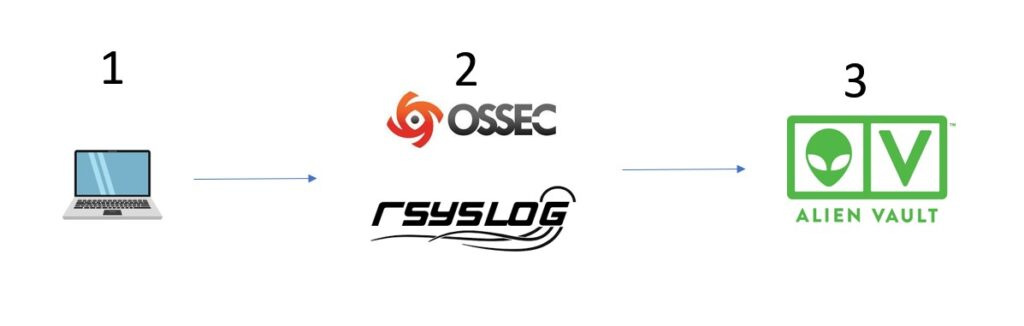
The basics are at stage 1 where the client (server, workstation etc) send logs (or have logs to be collected) to Alienvault. The initial filtering should theoretically happen here if possible. Many applications have the capability to control their logs – Windows server being one of them. Turning on debug logs on Linux for instance would cause a fair bit of log traffic across the network. Applications as well, have options of what to log and what not to log. We see firewalls logging traffic logs, proxies logging every single connection that goes through – this causes loads of logs hitting the Alienvault.

AV (especially the All In Ones) isn’t designed to take on heavy loads the way Splunk or other enterprise SIEM like ArcSight, that chews through 100,000 EPS like Galactus chews through planets. The AV approach has always been, we aren’t a SIEM only, we are a unified security management system, so security logs are what we are after. Correlation is what we are after. APT are what we are after. Their philosophy isn’t to overload and do generic Business Intelligence with millions of log lines, but to focus on Security and what is happening to your network. That being said, it’s no pushover as well, being able to work with 90 – 120 million events and going through 15,000 EPS on their enterprise.

The reality however is that most clients just turn on logs at Item 1 and plow these logs over to Alienvault. So it’s really up to Alienvault to start filtering these logs and stopping them coming in. At layer 2, is what we call the outer layer. This is the front line defence against these attacks of logs. These are where the engine running these log systems (OSSEC, rsyslog etc) can filter out and then trickle what is needed to Alienvault main engine itself in Layer 3. The AV main engine also has its form of defence, in policies, where we can create ‘junk’ policies to simply ignore logs coming in and not process them through the resource intensive risk assessment calculations.

So, we are going to assume that Layer 1 filtering wasn’t done. What we are going to look at is sorting out Layer 2 and we will assume that logs are coming in via OSSEC. We will have another article on Rsyslog filtering because that is a whole different novel to write.

When it hits OSSEC, it’s going via default port 1514/udp. Now remember, when logs first enters Alienvault, it doesn’t immediately go into the SIEM event display. It first needs to be logged, before it can be turned into events, before it can trigger alarms. So the basic rule is to get it logged:

Make sure you are receiving logs first.

This may seem juvenile in terms of understanding but we have been through enough to know that no matter WHAT the client says, oftentimes, their systems are not even sending the logs to us! A simple tcpdump -Xni eth0 “udp port 1514” will see if the logs are getting in, so go ahead with that first to ensure you are receiving. Just add a “and host <ip address>” if you need to filter it by the IP address.

Another way that Alienvault allows, when you are getting logs via HIDS/OSSEC is by enabling the “logall” on USM HIDS configuration, which we covered in the previous articles here. But be aware turning on logall potentially will bring a lot of logs and information into the box so we generally avoid this unless it’s really needed.

Once you are seeing logs coming into Alienvault, for OSSEC at least the next thing to do is to move these logs to “alerts.log” and from there, Alienvault can start putting it into the SIEM display.

For this to happen, you need to understand 3 things here, aside from the fact that we are currently now working on layer 2 from the diagram above – OSSEC:

a) Decoders

b) Rules

c) /var/ossec/bin/ossec-logtest

The above are actually OSSEC terminologies – not strictly Alienvault. What this means is that if you were to decouple OSSEC from Alienvault, you can. You can just download OSSEC. Or you could download other products like Wazuh, which is also another product we carry. Wazuh runs OSSEC (its own flavor) but has a different presentation layer (Layer 3 in our diagram above) and integrates with ELK to provide a more enterprise ready product but the foundation came from the same OSSEC principles. So when we talk about Rules and Decoders and using the ossec-logtest script to test your stuff, it’s not an Alienvault specific talk. Alienvault specific talk we can go later with plugins and stuff. In the actual ACSE course from Alienvault (at least the one I passed 5 years ago), there is really no mention on decoders and rules – it basically just focus on the core Alienvault items only.

At this point, we need to make the decision on whether to have the filtering done on OSSEC level (2) or on Alienvault level (3)? As a rule, the closer the filtering is done to source, the better…however, in our opinion, the filtering by Alienvault plugins is a lot more flexible and intuitive in design, compared to OSSEC (and because we are biasedly trained in Alienvault, but not so much in OSSEC). So for this article (which is taking VERY long in getting to its point), we are tasked to simply funnel the logs into /var/ossec/logs/alerts/alerts.log because that is where OSSEC sends its logs to and where we can get our AV plugins to read from.

The logs in /var/ossec/logs/archives/archives.log (remember, we turned on the logall option in the OSSEC configuration for this illustration) aren’t monitored by plugins. Because in a production environment, you won’t have that turned on. So, once you have logs into the alerts.log file, you are good to go, because then you can sit down and write plugins for Alienvault to use in the SIEM display.

OK – Firstly Decoders. OSSEC has a bunch of default decoders (like plugins in Alienvault) that is able to interpret a whole bunch of logs coming in. Basically, the decoder is set up with Regular expression to go through a particular file and just grab the information from the file and drop it into fields like IP address, date, source IPs etc. Similar to the AV plugin, but for this illustration, we are not going to use much of the OSSEC filtering, but simply to ensure we select the right logs and send them over to the alerts.log file.

So ok, let’s take the previous article example of having MySQL logs into Alienvault. Let’s say we have this example query log coming into our Alienvault (archive.log, if we turned it on)

2021 Feb 21 00:46:05 (Host-192-168-1-62) 192.168.1.62->\MySQLLOG/db.log 2021-02-22T09:41:42.271529Z        28 Query     SHOW CREATE TABLE db.persons

So the above doesn’t really offer much, but you can technically see there is the date and time, and the command line etc and a decoder will need to be created to parse the incoming log.

Picking up from where we left off at the Alienvault link, Task 4 covers the steps to create the decoder:

a) Edit /var/ossec/alienvault/decoders/local_decoder.xml and add in the following:

<decoder name="mysql-query">
        <prematch> Query</prematch>
</decoder>
<decoder name="mysql-connect">
        <prematch> Connect\s*</prematch>
</decoder>
<decoder name="mysql-quit">
        <prematch> Quit</prematch>
</decoder>

The above is simplistic decoder to catch the 3 important events from the logs coming in from MySQL – Query log, i.e

2021-02-22T09:41:42.271529Z        28 Query     SHOW CREATE TABLE db.persons

Connect Log

2021-02-20T16:35:28.019734Z        8 Connect   root@localhost on  using SSL/TLS

Quit

2021-02-20T18:29:35.626687Z       13 Quit  

Now of course, for those aware, the Query logs have many different types of query – Query Use, Query Show, Query Select, Query Set, Query Insert, Query Update and so on. The idea of the decoder is simply to catch all the queries, and we will theoretically log all Queries into Alienvault.

Now, remember to tell Alienvault you have a new decoder file

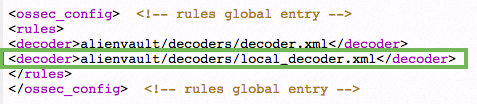
In the USM Appliance web UI, go to Environment > Detection > HIDS > Config > Configuration.

Add <decoder>alienvault/decoders/local_decoder.xml</decoder> after <decoder> :

Adding the "local_decoder.xmll" setting to ossec_config

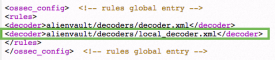
Adding this setting enables the usage of a custom decoder. Save it and restart HIDS.

So that’s it for the decoder.

Now, on the CLI, go to /var/ossec/bin and run ./ossec-logtest

Paste the following “2021-02-20T18:29:43.189931Z 15 Query SET NAMES utf8mb4”

And you should the get result as below

linux:/var/ossec/bin# ./ossec-logtest
2021/03/29 09:50:10 ossec-testrule: INFO: Reading decoder file alienvault/decoders/decoder.xml.
2021/03/29 09:50:10 ossec-testrule: INFO: Reading decoder file alienvault/decoders/local_decoder.xml.
2021/03/29 09:50:10 ossec-testrule: INFO: Started (pid: 25070).
ossec-testrule: Type one log per line.
2021-02-20T18:29:43.189931Z 15 Query SET NAMES utf8mb4
**Phase 1: Completed pre-decoding.
full event: '2021-02-20T18:29:43.189931Z 15 Query SET NAMES utf8mb4'
hostname: 'linux'
program_name: '(null)'
log: '2021-02-20T18:29:43.189931Z 15 Query SET NAMES utf8mb4'
**Phase 2: Completed decoding.
decoder: 'mysql-query'

So basically, any logs that come into archive.log that has that sample line “Query” you will be lumping it in as mysql-query decoded. Of course you can further refine it with Regular expression to get the exact term you wish, but for the illustration, we want to catch the queries here and it’s fine for now.

The next item is the rules. Again, referring to the Alienvault writeup above, go ahead and edit
/var/ossec/alienvault/rules/local_rules.xml.

What we will do is to add the following in

<group name="mysql-connect">
<rule id="192000" level="0">
<decoded_as>mysql-connect</decoded_as>
<description>Connect log is enabled</description>
</rule>

<rule id="192001" level="1">
<if_sid>192000</if_sid>
<regex>Connect\s*</regex>
<description>Connection is found</description>
</rule>
</group>


<group name="mysql-query">
<rule id="195000" level="0">
<decoded_as>mysql-query</decoded_as>
<description>Mysql Query log is enabled!</description>
</rule>


<rule id="195001" level="0">
<if_sid>195000</if_sid>
<match>SET</match>
<description>Query set is found and ignored!</description>
</rule>


<rule id="195002" level="1">
<if_sid>195000</if_sid>
<regex>Query\s*</regex>
<description>Query is found</description>
</rule>
</group>


<group name="mysql-quit">
<rule id="194000" level="0">
<decoded_as>mysql-quit</decoded_as>
<description> Quit log is enabled</description>
</rule>

<rule id="194001" level="1">
<if_sid>194000</if_sid>
<regex>Quit\s*</regex>
<description>Quit command is found</description>
</rule>
</group>

So what the above does is to decide what to do with 3 types of MySQL logs you are getting: Connect, Query and Quit. We want to dump these logs into alerts.log so that we can work on it with Alienvault’s plugin. We don’t want to do any fancy stuff here so it’s pretty straightforward.

Each of these 3 have a foundation rule

a) Connect – 192000

b) Quit – 194000

c) Query – 195000

Each rule has a nested rule to decide what to do with it. Notice you can actually do Regex or Match on the rules which really provides a lot of flexibility in filtering. In fact, if it wasn’t for Alienvault’s plugins, OSSEC’s filtering would probably be sufficient for most of your custom logs requirement.

For this illustration, our job is simple – for each of these rules, find out the key word in the log, and then escalate it to an alert. An alert is created when you create a rule ID with level = 1, i.e <rule id=”195002″ level=”1″>

If you run ossec-logtest again, and paste the log there, you would be able to see

**Phase 1: Completed pre-decoding.
full event: '2021 Feb 21 00:46:46 (Host-192-168-1-62) 192.168.1.62->\MySQLLOG/db.log 2021-02-22T09:42:21.711131Z 28 Quit'
hostname: '(Host-192-168-1-62)'
program_name: '(null)'
log: '192.168.1.62->\MySQLLOG/db.log 2021-02-22T09:42:21.711131Z 28 Quit'
**Phase 2: Completed decoding.
decoder: 'mysql-quit'
**Phase 3: Completed filtering (rules).
Rule id: '194001'
Level: '1'
Description: 'Quit command is found'
**Alert to be generated.

Once you see “alert to be generated” you will find that same alert in the /var/ossec/logs/alerts/alerts.log

AV - Alert - "1613881201" --> RID: "197011"; RL: "1"; RG: "connect"; RC: "Quit Command found"; USER: "None"; SRCIP: "None"; HOSTNAME: "(Host-192-168-1-62) 192.168.1.62->\MySQLLOG/db.log"; LOCATION: "(Host-192-168-1-62) 192.168.1.62->\MySQLLOG/db.log"; EVENT: "[INIT] 2021-02-22T09:42:21.711131Z        28 Quit       [END]";

From there, you can go about doing the plugins and getting it into the SIEM.

Whew. That’s it.

You would notice, however, there is another sub-rules in there for Query:

<rule id="195001" level="0">
<if_sid>195000</if_sid>
<match>SET</match>
<description>Query set is found and ignored!</description>
</rule>

This is set above the “alert” rule and you notice that this is Level=0. This means whatever Query that is decoded, first runs this rule and basically if I see there is a Query “SET”, I am going to ignore it. I.e it’s not a log I want and I am not going to put it into the alerts.log. Level 0 means, not to alert.

I am ignoring Query Set because in this case, we are finding millions of query set as it is invoked a lot of times and mostly it is false positives. I am interested in Query Selects, Inserts and Updates etc.

Once you have this rule put in, it will filter out all Query Sets. This is basically the only filtering we are doing so we don’t have those millions of Query Sets jamming up my alerts.log file in Alienvault.

alienvault:/var/ossec/logs/archives# ossec-logtest
2021/03/14 12:36:33 ossec-testrule: INFO: Reading decoder file alienvault/decoders/decoder.xml.
2021/03/14 12:36:33 ossec-testrule: INFO: Reading decoder file alienvault/decoders/local_decoder.xml.
2021/03/14 12:36:33 ossec-testrule: INFO: Started (pid: 12550).
ossec-testrule: Type one log per line.
192.168.1.62->\MySQLLOG/db.log 2021-03-14T16:22:58.573134Z 19 Query SET NAMES utf8mb4'
**Phase 1: Completed pre-decoding.
full event: '192.168.1.62->\MySQLLOG/db.log 2021-03-14T16:22:58.573134Z 19 Query SET NAMES utf8mb4''
hostname: 'alienvault'
program_name: '(null)'
log: '192.168.1.62->\MySQLLOG/db.log 2021-03-14T16:22:58.573134Z 19 Query SET NAMES utf8mb4''
**Phase 2: Completed decoding.
decoder: 'mysql-query'
**Phase 3: Completed filtering (rules).
Rule id: '195001'
Level: '0'
Description: 'Query set is found and ignored!'

So you see, from the above, all Query Sets are ignored. You can basically do whatever you wish by using either Regex or Match and ignore certain log messages from OSSEC itself. It’s very powerful and flexible and with enough time and effort, you can really filter out only the needed logs you want into Alienvault, which is really part of the fine-tuning process for SIEM.

So there you have it. What you have done now is to take those logs from archives.log and make sure you only put the logs you want in alerts.log (Quit, Connect, All Query except for Query Set).

The next thing you need to do is to go down to Alienvault (layer 3) and do the heavy lifting in writing plugins and get these events into the SIEM display.

For more information for Alienvault and how it can help your compliance, send us an email at alienvault@pkfmalaysia.com and we will get back to you ASAP!

Alienvault USM Anywhere Updates

We just received very good updates from the Alienvault channel team (or AT&T Cybersecurity team as they call themselves now). I think to quickly summarise our excitement into two short phrases:

a) Google Cloud Support – Heck Yeah.

b) Custom Plugin Development – Heck Yeah!

Of course, there were tons of other updates as well, such as scheduled reports, unified UI, more AlienApps support, Cloudflare integration (which is very interesting, as we can identify actions to it, effectively making Alienvault function more like an active prevention system, as opposed to its traditional detective role), new search capability incorporating wildcard searches and advanced asset importing through CSVs as opposed to rudely scanning our clients network.

But the two main courses were the Google Native support and custom plugin.

Google Native support has been a pain point for years. We do have customers moving into GCP or already into GCP where we have been constantly battling to match their expectations for Alienvault to perform as seamlessly as it does on AWS – but it can’t. We had to rely on EDR (endpoint detection and response) for instance, where the agent grabs logs a’la HIDS and sends it over to the server directly. Of course, areas where a native sensor would function, such as creating an internal VPC filter mechanism, or doing vulnerability scanning without having too much inter VPC traffic – these were not able to be done with the EDR so it was very much a bandaid. We knew that our patched up GCP solution wasn’t functioning as well as its handsomer and more dashing brother, AWS. In other words, it kinda sucked.

GCP custom applications also presented its own set of issues – custom apps were difficult to integrate – even with Stackdriver, or us logging to BigQuery, presented a lot of issues to send these logs to Alienvault. When we could configure to send to BigQuery, we couldn’t filter properly, causing our 1TB per month customer quota to be annihilated within days. Now, getting PUB/SUB to work with Alienvault requires APIs to be written, and on top of that to have Alienvault write the custom plugins – all these add to pro services costs, and more importantly, resource and time cost to the project.

So what happens now? In the next General Acceptance/Availability of USM-A, GCP will be supported. The information is sparse so more updates will be forthcoming. But the GCP sensor will be able to:

a) Perform threat detection (like all other sensors), asset discovery, provide Alarms, events, widgets, correlation etc. Basically, it will be native to GCP, doing what it is doing for AWS, Azure and on-prem Hyper and VMWare.

b) Detect VPC flow logs

c) Monitor cloud services through Stackdriver

The last bit is very important. Stackdriver, in essence, is GCP’s answer to Cloudwatch and Cloudtrail of AWS. It monitors and manages services, containers, applications and infrastructure for the cloud. If you have a Cloud services or developing cloud applications, you should be able to support Stackdriver logging. In GCP Compute, the logging agent is used to stream logs from VM Instances. It can even provide the traditional network flow logs (or VPC flow logs), which MSPs can use to monitor network health etc. In other words, this ugly GCP little brother solution is going to get buffed. We’re going to look a lot better now.

The roadmap is bright: Automatic response action against a cloud service when a security event occurs – putting Alienvault into more of a proactive than detective stance it takes traditionally. This is similar to what the Cloudflare integration is achieving. More and more GCP services will be added to be supported. There is also a topic on “User Entity Behaviour Analytics” – which is basically matching behaviour to normal baselines and telling us that Bob is having coffee at 10 am instead of his usual 8 am, which meant he was running late to work, which meant he got stuck in traffic, which meant he left the house late, which meant he woke up late, which meant he slept late last night, which meant he went out for a drink with someone and got smashed, which could possibly mean he is having an affair with a stripper named Daisy. Maybe.

So, pretty exciting times, Aliens!

The other one on the plate wasn’t on the normal discussion agenda but was brought up by us on the international call – we just bombarded the screen with around 10 – 15 queries and at least 4 made it to the table. One of them was: when the hell are we going to get to do our own plugins?

No offence to Alienvault, who currently for USM-A are doing our client’s custom plugins – but 3 – 4 weeks isn’t really going to cut it. Furthermore, sometimes we are not even getting what we want from the custom plugins. We don’t blame Alienvault. The application is ours (as in our client’s). We are the ones who know the events, the priorities. We know what we want to see. We just can’t develop the plugins like what we do now for our USM Appliance clients.

Imagine the win-win situation here. We write plugins for clients (assuming its similar to Appliance), within 2 – 3 days we are done. Testing, another 1 – 2 days. Instead of setting the project timeline back 3 – 4 weeks we are 1 week in. That’s a HUGE impact for compliance clients who are often chasing a deadline. 3 weeks squashed to 1? Hell, Yeah! The win is also for Alienvault. They don’t have to deal with nagging customers or smart-ass channel partners like us banging them for not updating us on our new application plugin. Imagine the parties engineers can now attend to instead of writing regex for a company operating in Elbonia. Imagine the time they now can save and spend socialising with the rest of the world, or having the chance to meet people like Daisy.

It’s a whole new world, really.

So, Alienvault, please, get those updates to us as soon as you can and the world will be a better place for it.

If you need any information on Alienvault, or general help on your SIEM or PCI-DSS compliance, drop us an email on alienvault@pkfmalaysia.com and we will attend to it immediately!

Alienvault USM – Flat File Log Capture – Part 1

We’ve been working with and on Alienvault since the beginning of 2016 and a lot has changed since then. When we started out with Alienvault, they were a small-ish company still, with big ambitions, working with a very technical group out of Cork, Ireland. We had direct access to their technical team (I think even to one engineer) and the amount of knowledge we got from those early days are pretty much invaluable to where we are right now. Of course, Alienvault has changed a lot since then, and now being part of AT&T – for the record, we believe they have the right roadmap to go into cloud with their USM Anywhere concept, and their product right now is much more robust and enterprise ready. They are on the right trajectory.

However, back in the days, for Alienvault USM Appliance (not Anywhere), which is their Appliance offering, we could literally ‘jailbreak’ the system and go into the underlying OS and do stuff to Alienvault that we can’t do anymore in Anywhere. Some of the changes we made were to increase optimisation, put in our own scripts to clean up the system, troubleshoot the system and of course, create plugins for custom applications. We would write custom plugins in 1 – 2 days for multiple applications because of deadlines, I remember and had to do so much in so little time – but we did it anyway. We had to write a plugin for one of the oldest mainframes for a financial institution that was so difficult to interpret, we had to dig up old manuals to sort out the entries for log and events. It was like we were interpreting Egyptian hieroglyphs. But that’s what it took – 2 days, I think because of compliance requirements and customer breathing down our neck to get it done.

Writing plugins was the easier part of the battle – in some old machines or legacy applications, getting the logs was the problem. If Alienvault doesn’t get the logs, it can’t do anything with it. One solution was to leverage on the HIDs (Host IDS), or OSSEC as it was known, to grab log files from systems. It wasn’t so elegant, and we still had to end up writing plugins for it to normalise, but it resolve the issue where application was not able to forward logs to the SIEM, or not able to write the logs to the Windows Event service, or any other way to get logs out to a syslogger. So the solution here is for the application to just write the logs to a file, and Alienvault go ahead and grab this and interpret it. It may not be real time, but it works.

There’s a good write up over in Alienvault at
https://www.alienvault.com/documentation/usm-appliance/ids-configuration/process-reading-log-file-with-hids-agent-windows.htm. So a lot of it is just a repeat and probably an exposition on why we are doing certain things in a certain way.

So the first thing to do here is to ensure that you are able to install HIDs on the server. HIDs will be the key to get this file out to Alienvault. Technically, you could actually use NXLog as well but let’s explore that another time.

Once HIDs is installed, get into the ossec configuration file to define the <localfile> location. Now assuming that you have configured your application to write to a flat file called database.log.txt.

Go ahead and restart OSSEC. That’s pretty much what you need to do to start off so it’s pretty simple.

The rest of it is all done on Alienvault.

To summarise the steps:

Enable “logall” on your USM Appliance. You want to dump whatever you are getting in that flat file database log to a log inside your Alienvault so you can start doing stuff to it. In this case, in your AV User Interface:

Environment > Detection > HIDS > Config > Configuration.

Add <logall>yes</logall> to the <global> section of the file .

You are dumping these logs into /var/ossec/logs/archives/archives.log.

Restart the HIDs service through UI.

You should be able to see new logs coming into archives.log. Just do a tail -f on it, edit the log file (database.log.txt) in your remote system (just write something on it) and see if it appears in your archives.log. Once you see it, you are almost done. Very simple.

So for now, you have customised logs coming into your Alienvault. The next thing to do is to interpret these logs and make sure events are able to be derived from these logs to something that is useful to you!

Drop us an email at alienvault@pkfmalaysia.com for more information on Alienvault or any technical queries you have, and we will attend to it.

Alienvault: File Integrity Monitoring on Linux Part 2

So based on our previous article you have so far set up OSSEC (or HIDS in Alien-speak) in your Linux host which you want to monitor. The next thing to do is to configure FIM to work.

To recap, we have a running CENTOS7 system running in our lab and we finally got our ossec to be communicating with the Alienvault server. You can verify connectivity either through the CLI logs, or using the USM Interface. Now the HIDS can be used for a lot of things – it’s obviously a Host IDS (hence the name), but it’s also a log forwarder as well, so for Linux systems, it doubles up as a security logger, so you don’t need to configure separate plugins to log, for instance SSH denied attempts. If you don’t have the HIDS, you have to forward logs from rsyslog then setup Alienvault plugin for SSH to normalise SSH logs and create those events. HIDS does this for you. Try it. You can attempt multiple logins with wrong password and you should see an event called “SSHD Authentication Failed.”

But for this article, we will be focusing on File Integrity Monitoring or FIM for short. FIM in Alienvault USM is utilising OSSEC inbuilt integrity checking process called Syscheck. Syscheck runs periodically and depending on how many files/directories it is checking can run from 10 minutes to much longer. By default, syscheck in Alienvault executes very 20 hours – if that’s too long for you , you can shorten it in the configuration.

Let’s jump straight in.

In Alienvault (Server if you are using Standard), go Environment -> Detection and on HIDS tab, click on Agent. In the lower tabs, click on SYSCHECKS.

Over here is where you configure the Syschecks on the Agents and you can modify the frequency.

Because we are using Linux, we are going to ignore the portion where Windows Registry is being configured and go straight to: ”

FILES/DIRECTORIES MONITORED

Under files/Directories, put in a sample directory you need to monitor, for instance

/etc/pkf

Don’t worry, out of the box, standard directories being monitored are

/etc

/usr/bin

/usr/sbin

/bin

/sbin

We have in some cases clients insisting on us putting in /var/log in there to inform them of changes occurring in this directory. According to them, log files are key and they need to know if these log files are being changed.

Um, yes. Agree on the first part. But /var/log changes almost every nanosecond. Syscheck is not going to be of much use here. They are probably thinking about log archives as opposed to the current log folder. Anyway, we digress.

So go ahead and put in your own directory in there under agents and then restart HIDS from Alienvault, and also for good measure restart the agent as well (you can go Agent Control -> Click on the clock symbol under the Agent Name to restart). To check, you can click on Agent.Conf tab and you will find something similar to:

<agent_config>
    <syscheck>
      <frequency>1200</frequency>
      <auto_ignore>no</auto_ignore>
      <alert_new_files>yes</alert_new_files>
      <scan_on_start>yes</scan_on_start>
<directories realtime="yes" report_changes="yes" check_all="yes">/etc/pkf</directories>
    </syscheck>
  </agent_config>

So it looks all set up. If you have restarted HIDS and also the agent, you should be able to verify on the agent itself if the configuration has been uploaded. On the client, go to

/var/ossec/etc/shared

Look into agent.conf file and you should be able to see the same thing as the configuration above. Also, you can go to

/var/ossec/logs

and look into ossec.log file and you should be able to see something like

ossec-syscheckd: INFO: Monitoring directory: '/etc/pkf'.
ossec-syscheckd: INFO: Directory set for real time monitoring: '/etc/pkf'.

So there you have it. You can do some testing now.

So we will go into the local directory of our CENTOS and go ahead to create a few random files. The first thing you notice is that even if in our config there was:

<alert_new_files>yes</alert_new_files>

We still do not get any alerts once we create new files in the directory. This is because OSSEC doesn’t check new files in realtime (just changes to files), and we will need to wait for our syscheck to run, or you can go ahead and restart the agent from the Alienvault GUI. For good measure, change a few things about the files as well.

You might notice a strange thing happening here.

Going into the SIEM, you might not find any events relating to integrity issues in your host. This doesn’t seem to be an isolated incident, if you head over to the Alienvault forum, you will see many people having the same issue: We have enabled FIM and we can’t find anything on the SIEM or any events!

If you check on the agent itself, and you click on the “modified files”

You will see a raw list of all the files modified and you will see that /etc/pkf/filename is there listed as well, so it means OSSEC is working and syscheck is working. Another way to verify is to head over to your Alienvault Server and go to

/var/ossec/logs/alerts 

grep pkf alerts.log

Basically I am doing a grep on anything that identifies the files or directories I am looking at to see if alerts are generated. You should change the grep to something related to your filename/directory name. You should be able to see that alerts are generated.

So what gives?

Plugins.

Apparently for some strange reason, some Alienvault setup by default does not have the proper plugins enabled to read the integrity alerts log of ossec. This is very strange, as FIM is touted as a feature for Alienvault, but we need to still work further to get it up and running. So go ahead to your Alienvault GUI:

Configuration -> Deployment

Click on System Detail of your Alienvault setup

Click on Sensor Configuration in the menu on the right side

Go to “Collection”

You notice you have Alienvault_HIDS and Alienvault_NIDS enabled. However, in some cases, Alienvault_HIDS-IDM plugin might be missing and can’t be found under “Plugins Available” column. IDM Is for identity management and it needs to be enabled for FIM to properly work.

The plugin that makes this happen is

ossec-idm-single-line.cfg

In our case, the plugin file was there in /etc/ossim/agent/plugins, but it wasn’t in the ossim database as a “Plugins Available” option. This generally means that it wasn’t (for some reason) written into the ossim-db. So head over to the directory in Alienvault:

/usr/share/doc/ossim-mysql/contrib/plugins

You will see that there is an ossec.sql.gz in there, so go ahead and unzip it and run

cat ossec.sql | ossim-db

alienvault-reconfig

Wait for the reconfig to occur then head back to the GUI of Alienvault, all the way back to the sensor configuration->collection and you will be able to see Alienvault_HIDS-IDM available for selection.

Go ahead and select it there, and then reconfig and now you can try to run the FIM test again.

a) Create a new file

b) Restart the agent (to simulate the syscheck being run)

c) Check SIEM , filter Data Sources to Alienvault HIDS, you should find

AlienVault HIDS: File added to the system.

d) Go to the host and edit the new file and change it

e) Go back and check SIEM and you will find

AlienVault HIDS: Integrity checksum changed.

The last event should be immediate and need not have any restart of the agent. Unless of course, we noticed if the change occurred during the time syscheck is running, if so the event will occur once syscheck finishes. It’s not perfect, but it will have to do.

Congratulations, you have FIM events up and running for Alienvault! If you need further assistance in any Alienvault matters, drop us an email at alienvault@pkfmalaysia.com and we will look into it.


Alienvault Deployment Checklist

avlogo

A while ago we were asked to share an Alienvault Deployment checklist. So here it is (by no means comprehensive but just to give you an idea of what you need to have)

a) All data sources listed and PIC (person in charge ready)

You have no idea how much time is actually wasted getting logs into Alienvault. As I said, as an AV implementer, we have no obligations to sort out why or how to configure data sources to send logs over to our system.

From Alienvault side, easiest way to determine if they are actually sending us stuff:

#tcpdump -Xni eth0 port 514

Assuming eth0 is your logging interface and you are sending using rsyslog. If OSSEC, then it would be 1514. If you don’t get anything, then stuff is not being sent to you.

Invariably we always end up troubleshooting for our client and its always one of these:

– routing issue

– network firewall issue

– host IDS/host firewall problem

b) VM should be set up properly

Sometimes our client expects us to troubleshoot their VMWare setup and install ESXi for them as well. This is not part of our scope of works, but again, when we go onsite, we find out that their VM environment is no where ready and we have to prep it up for them. Usually its either under resourced or not even created. Sometimes we find that they are running on a host machine that belongs in the museum rather than a DC and they insist that its good enough. Umm. 500GB hard disk and 4GB RAM? Come on.

c) IP Addresses allocation

Remember, you need to allocate the appropriate IP addresses

– Host IP address (for the VM host if you are starting scratch)

– Logging interface IP – this is where data sources send logs to

– Management Interface IP – lots of people gets confused with this and thinks this is required. You can use the logging interface as management interface. Unless you have another interface sitting in another management network, I would suggest to use the same interface as management. The problem with setting up two interfaces on the same network is that routing might get screwed up at times.

– Network Monitoring interface IP – you don’t need one. However you need to assign an interface to monitoring if you want to use IDS. By default the management interface is assigned.

d) Installation Key

If you are ready to install, make sure you have the installation key. For setup on CLI you won’t be able to copy and paste so you need to type the whole thing in. True story, we have gone to onsite before and set everything up and when it was time to enter the license key and we looked to the client, they went like “What license key?”

e) All equipment accessible

You would think this is a no-brainer, but you have no idea how many times we tried to install and client tells us, oh, we don’t have any internet access on this box yet. Doh!

f) Technical Checklist

– Before deployment, we should have the inventory list or BOM – how many servers, loggers, sensors and their locations. If its a small setup, then AIOs will do.

– List of network segments to be monitored – ensure span ports are set up and confirm how these are connected to sensors

– Full list of assets to be monitored by Alienvault. We need this and need to be careful. If there are a whole bunch of gateway proxies in that list and you have an AIO running, keep in mind that AIO processes up to 1000 EPS and I have seen proxies bunch together and get a lot more than 1000 EPS.

– Diagram of how AV is setup and distributed across networks. If they are all in the same network, then well and good. Are they traversing the internet to communicate, is VPN required between components?

– HIDS – how many, and how many on Linux and Windows?

– Vulnerability scans – are you running authenticated scans and if so do you have the correct credentials?

– Netflow – how many netflow sources are going to be integrated if you are using netflow?

– File Integrity Monitoring – do you have list of servers and directories/files to monitor?

– Baseline – do you have an idea of what baseline securities are there. For instance, your baseline for normal traffic could be “Access to critical server A is from 7 am to 7 pm Monday to Friday”. Therefore any access out of these hours are abnormal and considered an incident.

In summary, setting up a SIEM (at least for now), isn’t just plug and play and it does all the machine learning it needs to do. Alienvault has threat intelligence to assist in identifying attacks – but for fine tuning and filtering of logs, you would still need to work on it pretty much. But with a checklist in mind, hopefully you start the deployment on the right note.


« Older posts

© 2024 PKF AvantEdge

Up ↑