Category: SIEM (Page 3 of 6)

Alienvault Troubleshooting: The Missing Sensor

avlogo

USM Sensor not displayed properly at “AlienVault Center” of the USM Server

We have recently been involved in a few deployments of Alienvault. Aside from the All In Ones, we have had a few projects where separate sensor, loggers and servers were deployed, as well as even deploying USM Anywhere, Alienvault’s new flagship cloud centric product that literally makes Alienvault USM works – well – anywhere.

While the USM Anywhere deserves its own piece of article, in this short article we will explore the often seen problem we call: The Case of the Missing Sensor.

So, you have setup the standard server and sensor properly and as per the deployment guide that you find here. The configuration was well configured and the sensor peacefully connects to the USM Server. So you break open the celebratory glasses and start relaxing. You let your customer go through the whole features, absolutely confident that they will be impressed with everything you have done so far and they will be signing off the implementation sheet, and you will be paid and you will ….

“Hold on. Where is the sensor?”

Startled, you look at the screen and even though you have configured the server IP address in the sensor, you do not see any sensor under the Server’s Alienvault Center section. This makes it look like the sensor wasn’t  deployed but in fact all has been configured and accepted. If it didn’t show under AlienVault Center, you won’t be able to manage and update the sensor properly. Plus, it makes it look like you sold them a sensor but then ran away without actually installing one. Which makes you a charlatan. Which isn’t good.

So, you try the well tested “alienvault-reconfig” and cross your fingers. Do it on both server and sensor. No luck.

If you hit a brick wall on this, one method around it is to add the sensor manually into the server.  The below is the command used to fix it:

To add sensor into Server

#alienvault-api add_system --system-ip=[sensor's ip] --password=[sensor's root password]

Once you run the command, that doggone sensor should show up properly under the AlienVault Center and you look like a king in front of your customer. However, like all CLI commands, you need to make sure that if this is done on production, proper backup and proper due diligence has been done.

There is not much detail found but there is similar issue found at the Alienvault forum and the thread is a couple years old.

AlienVault Forum: https://www.alienvault.com/forums/discussion/1322/adding-sensors-to-the-alienvault-centre-display

Alienvault Deployment Checklist

avlogo

A while ago we were asked to share an Alienvault Deployment checklist. So here it is (by no means comprehensive but just to give you an idea of what you need to have)

a) All data sources listed and PIC (person in charge ready)

You have no idea how much time is actually wasted getting logs into Alienvault. As I said, as an AV implementer, we have no obligations to sort out why or how to configure data sources to send logs over to our system.

From Alienvault side, easiest way to determine if they are actually sending us stuff:

#tcpdump -Xni eth0 port 514

Assuming eth0 is your logging interface and you are sending using rsyslog. If OSSEC, then it would be 1514. If you don’t get anything, then stuff is not being sent to you.

Invariably we always end up troubleshooting for our client and its always one of these:

– routing issue

– network firewall issue

– host IDS/host firewall problem

b) VM should be set up properly

Sometimes our client expects us to troubleshoot their VMWare setup and install ESXi for them as well. This is not part of our scope of works, but again, when we go onsite, we find out that their VM environment is no where ready and we have to prep it up for them. Usually its either under resourced or not even created. Sometimes we find that they are running on a host machine that belongs in the museum rather than a DC and they insist that its good enough. Umm. 500GB hard disk and 4GB RAM? Come on.

c) IP Addresses allocation

Remember, you need to allocate the appropriate IP addresses

– Host IP address (for the VM host if you are starting scratch)

– Logging interface IP – this is where data sources send logs to

– Management Interface IP – lots of people gets confused with this and thinks this is required. You can use the logging interface as management interface. Unless you have another interface sitting in another management network, I would suggest to use the same interface as management. The problem with setting up two interfaces on the same network is that routing might get screwed up at times.

– Network Monitoring interface IP – you don’t need one. However you need to assign an interface to monitoring if you want to use IDS. By default the management interface is assigned.

d) Installation Key

If you are ready to install, make sure you have the installation key. For setup on CLI you won’t be able to copy and paste so you need to type the whole thing in. True story, we have gone to onsite before and set everything up and when it was time to enter the license key and we looked to the client, they went like “What license key?”

e) All equipment accessible

You would think this is a no-brainer, but you have no idea how many times we tried to install and client tells us, oh, we don’t have any internet access on this box yet. Doh!

f) Technical Checklist

– Before deployment, we should have the inventory list or BOM – how many servers, loggers, sensors and their locations. If its a small setup, then AIOs will do.

– List of network segments to be monitored – ensure span ports are set up and confirm how these are connected to sensors

– Full list of assets to be monitored by Alienvault. We need this and need to be careful. If there are a whole bunch of gateway proxies in that list and you have an AIO running, keep in mind that AIO processes up to 1000 EPS and I have seen proxies bunch together and get a lot more than 1000 EPS.

– Diagram of how AV is setup and distributed across networks. If they are all in the same network, then well and good. Are they traversing the internet to communicate, is VPN required between components?

– HIDS – how many, and how many on Linux and Windows?

– Vulnerability scans – are you running authenticated scans and if so do you have the correct credentials?

– Netflow – how many netflow sources are going to be integrated if you are using netflow?

– File Integrity Monitoring – do you have list of servers and directories/files to monitor?

– Baseline – do you have an idea of what baseline securities are there. For instance, your baseline for normal traffic could be “Access to critical server A is from 7 am to 7 pm Monday to Friday”. Therefore any access out of these hours are abnormal and considered an incident.

In summary, setting up a SIEM (at least for now), isn’t just plug and play and it does all the machine learning it needs to do. Alienvault has threat intelligence to assist in identifying attacks – but for fine tuning and filtering of logs, you would still need to work on it pretty much. But with a checklist in mind, hopefully you start the deployment on the right note.


Deployment of Alienvault in Practice Part 2

avlogo

So now you have a server instance of Alienvault in your network and you need to get your sensors up and running.

While a majority of small deployment can do with an All-In-One, there are reasons why you might need a separate server/sensor config. Remote sites for instance; where you want the sensor located onsite to perform log normalization, vulnerability assessments, availability etc. The sensor does quite a fair bit of work as well – and on top of that, it balances out the EPS. Remember, the AIO has a limit on EPS, so if you are looking at anything beyond 1,000 EPS, you are going to struggle to keep up with the events without a sensor.

Deploying a sensor is straightforward.

First, it’s important to understand a sensor does not have a GUI frontend, so all config is done on the Alienvault Setup Menu or CLI. This doesn’t make it any more difficult – in fact the hardest part of it is to include in the License Key in the menu – since we can’t cut and paste, so you need to make sure you do it correctly.

Second, you should always have a server instance before you go around setting up the sensor.

In the Alienvault Setup, go to Configure Sensor->Configure Alienvault Server IP. Now this should be your server IP. Some have asked should it be the management IP or the Logging IP. It should be the management IP, unless of course your management IP is not reachable, in that case, the only reachable IP is the logging IP of your server.

So go ahead and do the same for your framework IP address as well. Apply all changes and you are set.

Head back to the server, and go to the UI

Configuration->Deployment->Sensors

You will see the following message

Warning: The following sensors are being reported by as enabled by the server, but aren’t configured

Don’t worry about this, just click on Insert and you are done. It’s that straightforward. You will see the sensor listed, with the context it’s under, version and the status should have a checkbox next to t.

The final part is to get the Logger up and running.

Opposite from the sensor, the Logger is setup via the UI.

What’s important to understand here is that the flow is Sensor -> Server -> Logger.

So the logger is actually the end of the flow where all your logs are forensically stored and archived and validated. As far the server is concerned, it sees the Logger as a Parent.

ON THE LOGGER

Head over to the Logger UI (having already set it up as you did the server initially with IP Addresses, Licenses etc)

Go to Configuration->Deployment-> Servers and use “Add Server”

Again go ahead and use the IP address you have been using to define your server during your sensor config.

Once you have added the server and saved, head back to the Server screen and click on your logger instance (which should be there by default already)

Now select “NO” for everything except “LOG” in the form.

That’s it. You shouldn’t be type in the REMOTE USER and all that as this is done later in the Server.

ON THE SERVER

Now, back to the Server UI. Go to the same Configuration->Deployment->Servers.

It sometimes can get confusing here as the UI is the same, so make sure you name your Logger and Server appropriately!

On the server, you should see both the SERVER and LOGGER under the UI.

Modify the LOGGER (remember, you are on the SERVER UI, NOT THE LOGGER UI).

You won’t be able to change anything in there but you can set the Remote Admin and password to log into the Logger. Use the admin credentials (not the root) and let the URL populate itself by clicking on it.

Set “Remote Logger”

Finally, go back to the server screen and click on the SERVER -> Modify

You can now opt to set up Log to NO. Under that, in the Forward Servers option, click Add Server and go ahead add in your Logger.

Save and Apply all changes.

Click on Server Hierarchy and we have a nice primitive depiction of the Server pointing to the Logger. Well Done!

Now –  a note: If you are using an AIO UA as a server instance, you can set up the Log to YES in the AIO. That means you are logging in both locations.

In your logger, interface you will see that you have two different color boxes, depicting which Logger it is sent to.

If for some reason you want to say, OK, for asset 1 – 20 send to AIO, and for Asset 21 – 100, send to the Logger, you can disable the forwarding we set up above, and do it via policies. The great thing about Alienvault is that it allows that granular flexibility to control where your AIO wants to forward (or not forward) logs to.

We will explore Policy Setup in the future.

For now, enjoy your three piece band – Sensor, Server and Logger!


Deployment of Alienvault in Practice Part 1

avlogo

In this article, we are going to explore deploying Alienvault in practice. While there are many documents out there that give pretty clear steps on what to do, these documents are somewhat pretty distributed, and we don’t want to come to a point where we are 85% into the deployment, only to find that we were supposed to do something 25% in and did not do it.

Before anything else, you should have a deployment checklist to make sure everything is in order. The checklist is pretty long, much too detailed to put into a post like this Email us at alienvault@pkfmalaysia.com, and we can get you started.

In this example, we will be using a 3 piece band: the Server, the sensor and the logger. You can generally just trade the server for an AIO, which we did, but in general, it’s going to serve as a server. Remember though, with an AIO, you do have an additional sensor if you want to enable it, or a logger as well, with around 4 TB of compressed space (vs 9TB of compressed space for a standalone logger).

With that out of the way, and assuming that physically everything is racked and connected, and the VMs are up and running, you are ready to go. Remember, if you have separate systems, always start with the server (or the AIO) first, and then only move on to the sensor. Else, your sensor might be orphaned.

Now, of course, if you are using virtual appliance, your VMWare needs to be set up. Some questions we encountered is, how many interfaces we should have. Well, you should have the management interface (and use that as log collection), and the other interfaces would be for monitoring. Now one of the trick questions here is that, hey, I want to have a separate management interface and log collection interface. So that you know, nobody knows my management interface.

Possible. But we have seen deployments where both the management interface and log collection interface sits on the same subnet. This is probably going to cause some issues – one of it is routing might likely be screwed up. Another thing is that deployment of HIDS might constantly refer back to the management interface. So, rule of the thumb:

If you only have one subnet, just use the one interface for management and log collection.

Another question we have is, by default, AIO comes with six interfaces. (because, remember, it’s also a sensor!). Some clients have it in their minds to use all six interfaces. Generally, aside from the management and log, all the other interfaces won’t be assigned an IP and will be monitoring interfaces (i.e put it in a SPAN port and monitor away). Now unless you have very specific reasons to, it would not be so likely to use all monitoring interfaces (depending on how you set it up), so don’t feel like you are losing out. A lot of the setups we see simply has the sensor or AIO located at a central switch with SPAN or TAP and monitors fine.

Another question: Thin or thick provisioning for disk format. Well – we are used to just setting it as thin, meaning that it will just grow as the logs increase, but if you have space, setting it to thick might still be fine. I am not a VMWare guru, and I am sure the VMWare gurus out there will go into battle with this one, but we’ve deployed on both disk format and it doesn’t seem to have an extreme impact at all. Of course, I stand to be corrected.

Yet another question (even before we go into deployment!) is if I buy a hardware with a hard drive of 200TB, can Alienvault use all the 200TB instead of the measly 1TB for AIO and 1.8TB for Logger? The short of the answer is no, the size of the virtual machine is in the OVF itself, so if you purchase a ridiculous amount of hard drive space, the alienvault image is still going to occupy what it is going to occupy. But hey, you could start hosting other virtual systems there of course and use them up!

Setting up the server

1) Ok, finally, let’s get down to it. Once you boot up and assuming you have installed the OVF correctly if you are running virtual appliance, you will be dropped into the setup menu. Select Manual network interface and define an IP. I would suggest this as opposed to depending on a DHCP server. Aside from that, other setup paramaters are what you should expect and should be able to fill up pretty easily.

Now one of the annoying things that sometimes we face is that when the initial setup is rebooted, we get stuck at that Alienvault face that keeps loading but nothing happens. To be safe, when you reboot, just keep pressing ESC till you see the booting details. If you are still stuck, alt+F2 might be able to escape you. Else, you might need to give it the good old Vulcan Nerve Pinch. (Ctrl-Alt-Del).

Other times, you might just be stuck at VMWare console and the annoying “Waiting for connection” that seems to hang. Your system is fine, it’s just the VMWare console is moody. Restarting your Vsphere might do the trick.

Once you can SSH into your box you are confronted with a login screen and once logged in, you need to change the root password. Don’t forget it!

After that, register your appliance. Now, if you are running on AIO/server/logger, I would suggest to do an online Web UI registration. Obviously you will need connectivity to the internet. You can copy and paste your product license key once you access the Web UI as there will be an option for you in the Free Trial Screen. After that, you can set up the admin user and password. There is an offline technique as well, or if you are in the mood to type the entire license, you can do so from the alienvault menu itself.

After this is done, set up the hostname. You need to do this from the alienvault setup menu, select System Preferences -> Configure Hostname.

Make sure you apply all changes. Once you apply all changes, go ahead and reboot the appliance from the menu itself.

Another important thing is to change the time zone. After reboot, head over to

System Preferences -> Change Location -> Date and Time -> Configure Time Zone. Select the place you are at and apply all changes.

Likewise, you might want to use an NTP (network time protocol) server as well. In the same Data and Time menu, select Configure NTP Server. Enable it by selecting it and put in the NTP hostname (if you have DNS defined) or IP. Apply everything.

Now, this might be a good time to check on the linux box if your time is correct.

Jail Break your system, and type in ‘date’, you should see it changed.

Likewise go to WebUI, login and click on Settings at the top right. Make sure the time zone for that user is properly defined. Now check back on the SIEM (Analysis -> SIEM) on the WebUI , you should see the Date as whatever timezone you have defined yourself in.

Timestamping is obviously a big deal in any SIEM, and other than these areas to be wary off, we should also know that individual plugins also have timezone options. This is helpful if the data source suddenly changes timezones and we have to accomodate the data source.

It looks like the server is all set. If you have an AIO, you should also now see under

Configuration -> Deployment -> Sensors / Servers , your IP address because you are a Sensor and a Server.

Next, we will look at setting up the sensor and logger.


Alienvault with NXLog Conclusion

AVNXLog

This is the final part of our foray into NXLog and Alienvault.

To recap: You have enabled Rsyslog over TCP, you have forwarded NXlog IIS FTP logs over to Alienvault, you have created an initial plugin to identify unsuccessful logins and done the CFG and SQL files and wrote into the ossim-db.

You need to do one more thing:

Alienvault-reconfig

The command reconfigures the whole system, to ensure that the plugin is properly used.

Once done, you can do the following:

Cat /var/log/alienvault/agent/agent.log | grep 10000

Now finally you might be able to see something like

Apr  4 11:30:18 VirtualUSMAllInOne ossim-agent: Alienvault-Agent[INFO]: Plugin[10000] Total lines [138] TotalEvents:[22]  EPS: [0.00] elapsed [10.01] seconds

Which means out of 138 lines in the log, Alienvault was able to parse 22 into events. Which makes sense since you only set up one policy – Unsuccessful Logins.

The best practice is simply to have a generic ‘Catch All’ policy at the end of the plugin which is extremely general and will catch everything else. With the methods in the previous article, hopefully you will be able to grasp this cryptic skill of plugins creation. Go ahead and try it.

If you head over to GUI, Go to Configuration->Threat Intelligence->Data Source->Data Source Groups.

Now create a new group and call it ‘EVERYTHINGISAWESOME’. Or something you like.

Now, lets add Data Source. Select the new data source you created, 10000.

Now head to Analysis->SIEM.

Filter Data Source Groups to the group you just created.

AWESOME! You can see UNSUCCESSFUL LOGIN and finally there is a source and destination IP and no longer 0.0.0.0

Go ahead and click on it and feel the warm, fuzzy feeling of success flow over you.

There’s one last thing you will need to do before we wrap this up in a ribbon.

Custom Directives.

You see, at the end, all the stuff you see in SIEM is useful only if you are eyeballing it. And in general, most people would rather eyeball the latest episode of the Walking Dead as opposed to eyeballing a SIEM. Heck, some people I know would rather eyeball a tulip growing than watching logs in a SIEM. That’s where Alarms come in. Alienvault has a very simple philosophy on alarms: if the Priority of the event, the Asset Value and the Reliability of that event is high enough, we are gonna throw out an Alarm. An Alarm is something that you should be somewhat…alarmed about.

So back to our unsuccessful login. In theory, if someone did one unsuccessful login, you would chalk it up to a typo. Two in a row, within 1 seconds, well, maybe he’s in a hurry. 5 in a row within 5 seconds, he’s going to look suspicious, but hey, he could be someone from senior management. Or the marketing director who thinks the DVD drive is a cupholder. 10 in a row within 10 seconds? OK, I’m just going to throw up an alarm and let the security guys know about this fellow.

How does it work?

Without going into too much intricacies of the Alienvault engine, it’s basically down to directives. And after wading through the swamp called custom plugins, you will find this a lot easier as it’s mostly done on the GUI.

First of all, obviously, make sure your custom plugin works.

Then, head to Configuration->Threat Intelligence and click on Directives.

You will see ‘User Contributed’ as empty. You can either create one from scratch or clone an existing one. I recommend the latter. Alienvault ships with around 2,000 directives in built and I would just feel bad to neglect the existing ones….I am sure the Alienvault engineers will be happier if you used theirs. They worked hard on these directives.

OK – for this case, I specifically want to know if someone is trying to bruteforce my extremely sensitive FTP server (I know, you are asking why I am using FTP and not SFTP, and my answer is: ILLUSTRATION.). So the first thing I do is, look, there is a convenient directive group called ‘Bruteforce Attack’. You already have over a hundred directives drawn out for you. Click on it.

Take your pick in any of the directives shown. For me, I chose

AV Bruteforce attack, FTP authentication attack against DST_IP 

Click on the “Clone” icon next to it.

You will find there’s one directive now under ‘User Contributed’.

You need to modify it somewhat.

AVDirective

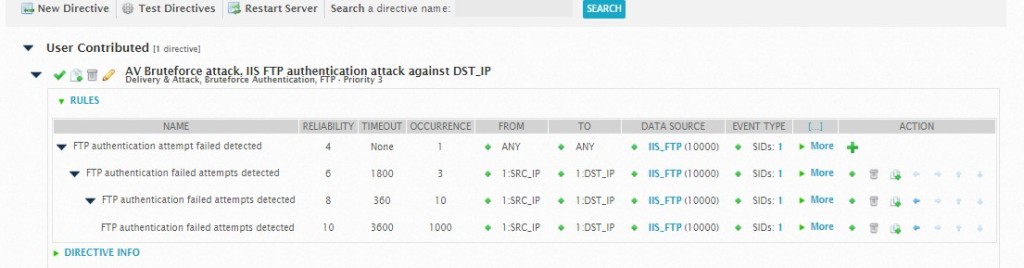
A brief understanding will be useful here. This directive is basically saying:

a) If there is ONE occurrence of unsuccessful login from any IP to any destination that uses this data source, set the reliability to 4. Now, depending on your priority (usually it’s 3) and your asset value (usually it’s 2), this won’t throw an Alarm. The alarm works by

(Reliability X Priority X Asset Value) >= 25

So if you set your asset value as 5, then even one single wrong login will light up your Alarm panel.

b) So back to the rule – if there is 3 occurences of wrong login from the same source and same destination, we are going to raise the reliability up a little. But notice the timeout value – The timeout value defines how many seconds the plugin will wait to receive a response from the destination to which the request was sent. So if we don’t get a response within the timeout period the rule expires and the directive process defined in the rule is discarded.

c) Change the data source to the one that you created, in this case IIS_FTP and in the popup, select UNSUCCESSFUL LOGINS (in our case, the SID is 1). Everything else, we just took it from the original directive.

d) Restart the server. This doesn’t actually restart the whole Alienvault, just the correlation machine, so don’t worry that your SIEM is going to go down.

The final test is to just try to login into your FTP server with wrong passwords repeatedly.

Now head over to your Analysis->Alarms

You will see

AV Bruteforce attack, IIS FTP authentication attack against Host-192-168-0-35

Click on the details and scroll down and you will see the corresponding events and the correlation level of each event. You will see right at the bottom, after the first four attempts, an alarm was raised and the correlation level was raised. Then it goes through the next set of rules – after 10 attempts again, an alarm was raised and correlation level was raised.

Using policies (not covered here, else this article will be the size of War and Peace) – we can then decide what we want to do with this alarm – open a ticket, execute a script, send an email or trigger an SMS etc.

That’s about it. So we’ve covered getting NXLog all the way to Alienvault, Alienvault interpreting it through a plugin you created, and then using these new custom events to trigger an alarm using a directive you modified.

Welcome to the Alien Nation!

« Older posts Newer posts »

© 2024 PKF AvantEdge

Up ↑