Tag: siem (Page 2 of 3)

Tonight, I Wanna Cry

There is a country song that goes:

I’ve never been the kind to ever let my feelings show,
And I thought that being strong meant never losin’ your self control
But I’m just drunk enough, to let go of my pain,
To hell with my pride, let it fall like rain, from my eyes,
Tonight I wanna cry.

And cry they did. Almost 75,000 and counting, over 99 countries hit by one of the largest ransomware attacks of all time, “WannaCry” and the other Wanna* variants.

Wannacry was released on the 12th of May 2017. The irony of it all was that we were invited as one of the speakers in a Ransomware event in Putrajaya under Panda Security the day before and we were just warning those in attendance that the next wave of ransomware is due to hit and within 24 hours, bam, we have Wannacry. In Malaysia, there seems to be already infection, thanks to the guys at

https://intel.malwaretech.com/botnet/wcrypt/?t=24h&bid=all

There have been reports of large telecommunication companies, banks and telcos are being affected. Tens of thousands of networks worldwide have been hit and the attacks do not appear to be targeted to any specific region or industry. Once infected, victims are asked to pay approximately $300 by Bitcoin. For the curious, you can check

https://bitref.com/13AM4VW2dhxYgXeQepoHkHSQuy6NgaEb94

This means there is around 5.8348 bitcoins paid already to this. Which translates to around RM46,000 paid so far – which isn’t so much if you think the average of ransom payment is around RM10,000 – RM11,000 for other ransoms.

So what is this?

Wannacry is using the file extension .wncry, and it also deletes the Shadow Copies (which is normal for ransomwares, like Locky) which is a technology introduced into the Microsoft platforms as far back as Windows XP and Windows Vista as the Volume Shadow Copy service. This means that even backup copies produced by this service, such as Windows Backup and System Restore will be screwed. That’s mean. Here is the command executed.

cmd.exe /c vssadmin delete shadows /all /quiet & wmic shadowcopy delete & bcdedit /set {default} bootstatuspolicy ignoreallfailures & bcdedit /set {default} recoveryenabled no & wbadmin delete catalog -quiet (PID: 2292)

The following file is also created in the affected systems: @Please_Read_Me@.txt

How it gets in is just like any other ransomware: email either phishing or spear phshing. Basically, don’t click on any email attachments that are suspicious! It’s easier said than done, especially if you see one coming in stating that you are behind in your payments for your credit card. Resist the urge. One of the things to check on email:

The return email – most phishing doesn’t even attempt to spoof their email, and you will get emails coming from strange domains like maaybank or clmbclicks. Bad language is also a hallmark of a phishing email. “All your base are belong to us” type of english. Anyone asking for passwords, or click on a link etc is nonsense. Don’t click on email links. Don’t click on the attachments, above all.

Back to Wannacry. It exploits a known Microsoft Windows vulnerability to spread. This vulnerability was released as part of the Shadow Brokers leaks back in April. It hits the SMB (Server Message Block) – some people pronounce it as SAMBA, which technically is not so correct, as SAMBA is the SMB implementation on Linux. It basically allows the sharing of files and printers in networked environment. Which means, if one gets infected, the infection spreads through network shares even to systems without connectivity to the internet.

Microsoft released a patch for MS17-010 on March 14th 2017. Obviously, a lot of systems – especially those in healthcare still runs on Windows XP. The case has been deemed so serious that Microsoft has taken the step to release patches for systems already dead like XP! This shows how unusually dangerous this ransomware is.

OK, so if you have been hit, what do you do?

Well, you can pay. Around 41 transactions have been made so you could make the number, but don’t expect too much out of it. In fact, we probably do not recommend this course of action. You need to remove Wannacry and there are plenty of sites that gives details on that. The problem with ransomware is not so much of removing it, its a matter of recovering your files. Here’s a site you can check if there is a decryptor available:

https://www.nomoreransom.org/crypto-sheriff.php

Please be careful – some so called ‘decryptors’ are disguised as further malware and gets you a double whammy of sorts, so you need to ensure these are proper tools and not something you download from torrent.

As an advisory to all our clients, especially PCI-DSS here’s what you can do to protect yourself:

a) PATCH

https://technet.microsoft.com/en-us/library/security/ms17-010.aspx

Now we see how important it is to patch your systems. Most PCI clients struggle on this and the examples can come from: Our servers are not connected to the internet, or If I patch, my application breaks. Well, if your application breaks then you need to get a warranty from your developers or get them to upgrade and improve.

b) Backup

While PCI doesn’t really focus much on backup or BCP (after all PCI’s interest is in the confidentiality of credit card and not the availability of your business) – it’s still good practice to backup your system. And not just online as ransomware hits shadow copies firstly – but offline backup and ensure your restoration has been tested. Remember those grandfather-father-son backup scheme you learnt in college and university? Yup, it can be applied.

c) Antivirus and Antimalware Updates

While it’s known Antivirus is missing a chunk of malware out there, it’s still for many systems the last line of defence and most vendors have released protection signatures for the ransomware so get it updated. It’s like having the final militia protecting against an invasion. It will probably not hold out forever, but at least it buys your administrators some time.

d) Remove SMB v1 support

https://support.microsoft.com/en-us/help/2696547/how-to-enable-and-disable-smbv1,-smbv2,-and-smbv3-in-windows-vista,-windows-server-2008,-windows-7,-windows-server-2008-r2,-windows-8,-and-windows-server-2012

Simply, for Windows 8 for instance, you need to run Powershell in administrator mode and then just issue

Set-SmbServerConfiguration -EnableSMB1Protocol $false

to disable SMBv1

e) Network segmentation

While this is helpful, it still doesn’t save everyone. Segmentation helps because it isolates computers. Vector of attacks usually comes into the access network (where end users access) and if you segment this from the critical systems, you will need the malware to traverse through your firewall or a filtering device in between which leads us to:

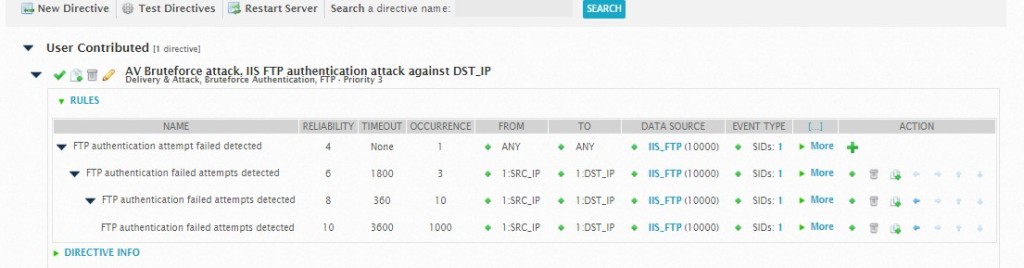
f) IDS, SIEM, IPS or any protection systems you have!

If you don’t have any IDS, IPS or SIEM deployed in your environment, it’s time you get one and this is a good argument for your business budget. IDS/IPS are usually available features in most firewalls these days, so if you segregate your networks, you can then enable these features and it should detect or prevent malware coming into your critical environment.

SIEM is critical. Security Information and Event Management systems have been around since the dawn of time but most companies avoid these due to costs, ever relying on the good old free syslog services. No, not allowed anymore, as far as PCI is concerned. We need more visibility over these logs, malicious traffic and even outgoing traffic to check if there is any communications with a command and control (C&C) server, which is the normal operations of these ransomware. SIEM these days are also no longer that expensive, with a Gartner SIEM like Alienvault starting off at a little over RM25K to get it up and running. We recently deployed a very large SIEM deployment over AWS cloud and on-premise on a major airlines with a fraction of the cost compared to traditional SIEM deployments.

There you have it. WannaCry is a very serious outbreak and we will be monitoring this system and also making our visits to our clients to give a short talk and description over it. If you have any questions over this, or on PCI-DSS or SIEM, drop us a note at avantedge@pkfmalaysia.com.

Stay safe!

Deployment of Alienvault in Practice Part 2

avlogo

So now you have a server instance of Alienvault in your network and you need to get your sensors up and running.

While a majority of small deployment can do with an All-In-One, there are reasons why you might need a separate server/sensor config. Remote sites for instance; where you want the sensor located onsite to perform log normalization, vulnerability assessments, availability etc. The sensor does quite a fair bit of work as well – and on top of that, it balances out the EPS. Remember, the AIO has a limit on EPS, so if you are looking at anything beyond 1,000 EPS, you are going to struggle to keep up with the events without a sensor.

Deploying a sensor is straightforward.

First, it’s important to understand a sensor does not have a GUI frontend, so all config is done on the Alienvault Setup Menu or CLI. This doesn’t make it any more difficult – in fact the hardest part of it is to include in the License Key in the menu – since we can’t cut and paste, so you need to make sure you do it correctly.

Second, you should always have a server instance before you go around setting up the sensor.

In the Alienvault Setup, go to Configure Sensor->Configure Alienvault Server IP. Now this should be your server IP. Some have asked should it be the management IP or the Logging IP. It should be the management IP, unless of course your management IP is not reachable, in that case, the only reachable IP is the logging IP of your server.

So go ahead and do the same for your framework IP address as well. Apply all changes and you are set.

Head back to the server, and go to the UI

Configuration->Deployment->Sensors

You will see the following message

Warning: The following sensors are being reported by as enabled by the server, but aren’t configured

Don’t worry about this, just click on Insert and you are done. It’s that straightforward. You will see the sensor listed, with the context it’s under, version and the status should have a checkbox next to t.

The final part is to get the Logger up and running.

Opposite from the sensor, the Logger is setup via the UI.

What’s important to understand here is that the flow is Sensor -> Server -> Logger.

So the logger is actually the end of the flow where all your logs are forensically stored and archived and validated. As far the server is concerned, it sees the Logger as a Parent.

ON THE LOGGER

Head over to the Logger UI (having already set it up as you did the server initially with IP Addresses, Licenses etc)

Go to Configuration->Deployment-> Servers and use “Add Server”

Again go ahead and use the IP address you have been using to define your server during your sensor config.

Once you have added the server and saved, head back to the Server screen and click on your logger instance (which should be there by default already)

Now select “NO” for everything except “LOG” in the form.

That’s it. You shouldn’t be type in the REMOTE USER and all that as this is done later in the Server.

ON THE SERVER

Now, back to the Server UI. Go to the same Configuration->Deployment->Servers.

It sometimes can get confusing here as the UI is the same, so make sure you name your Logger and Server appropriately!

On the server, you should see both the SERVER and LOGGER under the UI.

Modify the LOGGER (remember, you are on the SERVER UI, NOT THE LOGGER UI).

You won’t be able to change anything in there but you can set the Remote Admin and password to log into the Logger. Use the admin credentials (not the root) and let the URL populate itself by clicking on it.

Set “Remote Logger”

Finally, go back to the server screen and click on the SERVER -> Modify

You can now opt to set up Log to NO. Under that, in the Forward Servers option, click Add Server and go ahead add in your Logger.

Save and Apply all changes.

Click on Server Hierarchy and we have a nice primitive depiction of the Server pointing to the Logger. Well Done!

Now –  a note: If you are using an AIO UA as a server instance, you can set up the Log to YES in the AIO. That means you are logging in both locations.

In your logger, interface you will see that you have two different color boxes, depicting which Logger it is sent to.

If for some reason you want to say, OK, for asset 1 – 20 send to AIO, and for Asset 21 – 100, send to the Logger, you can disable the forwarding we set up above, and do it via policies. The great thing about Alienvault is that it allows that granular flexibility to control where your AIO wants to forward (or not forward) logs to.

We will explore Policy Setup in the future.

For now, enjoy your three piece band – Sensor, Server and Logger!


Deployment of Alienvault in Practice Part 1

avlogo

In this article, we are going to explore deploying Alienvault in practice. While there are many documents out there that give pretty clear steps on what to do, these documents are somewhat pretty distributed, and we don’t want to come to a point where we are 85% into the deployment, only to find that we were supposed to do something 25% in and did not do it.

Before anything else, you should have a deployment checklist to make sure everything is in order. The checklist is pretty long, much too detailed to put into a post like this Email us at alienvault@pkfmalaysia.com, and we can get you started.

In this example, we will be using a 3 piece band: the Server, the sensor and the logger. You can generally just trade the server for an AIO, which we did, but in general, it’s going to serve as a server. Remember though, with an AIO, you do have an additional sensor if you want to enable it, or a logger as well, with around 4 TB of compressed space (vs 9TB of compressed space for a standalone logger).

With that out of the way, and assuming that physically everything is racked and connected, and the VMs are up and running, you are ready to go. Remember, if you have separate systems, always start with the server (or the AIO) first, and then only move on to the sensor. Else, your sensor might be orphaned.

Now, of course, if you are using virtual appliance, your VMWare needs to be set up. Some questions we encountered is, how many interfaces we should have. Well, you should have the management interface (and use that as log collection), and the other interfaces would be for monitoring. Now one of the trick questions here is that, hey, I want to have a separate management interface and log collection interface. So that you know, nobody knows my management interface.

Possible. But we have seen deployments where both the management interface and log collection interface sits on the same subnet. This is probably going to cause some issues – one of it is routing might likely be screwed up. Another thing is that deployment of HIDS might constantly refer back to the management interface. So, rule of the thumb:

If you only have one subnet, just use the one interface for management and log collection.

Another question we have is, by default, AIO comes with six interfaces. (because, remember, it’s also a sensor!). Some clients have it in their minds to use all six interfaces. Generally, aside from the management and log, all the other interfaces won’t be assigned an IP and will be monitoring interfaces (i.e put it in a SPAN port and monitor away). Now unless you have very specific reasons to, it would not be so likely to use all monitoring interfaces (depending on how you set it up), so don’t feel like you are losing out. A lot of the setups we see simply has the sensor or AIO located at a central switch with SPAN or TAP and monitors fine.

Another question: Thin or thick provisioning for disk format. Well – we are used to just setting it as thin, meaning that it will just grow as the logs increase, but if you have space, setting it to thick might still be fine. I am not a VMWare guru, and I am sure the VMWare gurus out there will go into battle with this one, but we’ve deployed on both disk format and it doesn’t seem to have an extreme impact at all. Of course, I stand to be corrected.

Yet another question (even before we go into deployment!) is if I buy a hardware with a hard drive of 200TB, can Alienvault use all the 200TB instead of the measly 1TB for AIO and 1.8TB for Logger? The short of the answer is no, the size of the virtual machine is in the OVF itself, so if you purchase a ridiculous amount of hard drive space, the alienvault image is still going to occupy what it is going to occupy. But hey, you could start hosting other virtual systems there of course and use them up!

Setting up the server

1) Ok, finally, let’s get down to it. Once you boot up and assuming you have installed the OVF correctly if you are running virtual appliance, you will be dropped into the setup menu. Select Manual network interface and define an IP. I would suggest this as opposed to depending on a DHCP server. Aside from that, other setup paramaters are what you should expect and should be able to fill up pretty easily.

Now one of the annoying things that sometimes we face is that when the initial setup is rebooted, we get stuck at that Alienvault face that keeps loading but nothing happens. To be safe, when you reboot, just keep pressing ESC till you see the booting details. If you are still stuck, alt+F2 might be able to escape you. Else, you might need to give it the good old Vulcan Nerve Pinch. (Ctrl-Alt-Del).

Other times, you might just be stuck at VMWare console and the annoying “Waiting for connection” that seems to hang. Your system is fine, it’s just the VMWare console is moody. Restarting your Vsphere might do the trick.

Once you can SSH into your box you are confronted with a login screen and once logged in, you need to change the root password. Don’t forget it!

After that, register your appliance. Now, if you are running on AIO/server/logger, I would suggest to do an online Web UI registration. Obviously you will need connectivity to the internet. You can copy and paste your product license key once you access the Web UI as there will be an option for you in the Free Trial Screen. After that, you can set up the admin user and password. There is an offline technique as well, or if you are in the mood to type the entire license, you can do so from the alienvault menu itself.

After this is done, set up the hostname. You need to do this from the alienvault setup menu, select System Preferences -> Configure Hostname.

Make sure you apply all changes. Once you apply all changes, go ahead and reboot the appliance from the menu itself.

Another important thing is to change the time zone. After reboot, head over to

System Preferences -> Change Location -> Date and Time -> Configure Time Zone. Select the place you are at and apply all changes.

Likewise, you might want to use an NTP (network time protocol) server as well. In the same Data and Time menu, select Configure NTP Server. Enable it by selecting it and put in the NTP hostname (if you have DNS defined) or IP. Apply everything.

Now, this might be a good time to check on the linux box if your time is correct.

Jail Break your system, and type in ‘date’, you should see it changed.

Likewise go to WebUI, login and click on Settings at the top right. Make sure the time zone for that user is properly defined. Now check back on the SIEM (Analysis -> SIEM) on the WebUI , you should see the Date as whatever timezone you have defined yourself in.

Timestamping is obviously a big deal in any SIEM, and other than these areas to be wary off, we should also know that individual plugins also have timezone options. This is helpful if the data source suddenly changes timezones and we have to accomodate the data source.

It looks like the server is all set. If you have an AIO, you should also now see under

Configuration -> Deployment -> Sensors / Servers , your IP address because you are a Sensor and a Server.

Next, we will look at setting up the sensor and logger.


Alienvault with NXLog Conclusion

AVNXLog

This is the final part of our foray into NXLog and Alienvault.

To recap: You have enabled Rsyslog over TCP, you have forwarded NXlog IIS FTP logs over to Alienvault, you have created an initial plugin to identify unsuccessful logins and done the CFG and SQL files and wrote into the ossim-db.

You need to do one more thing:

Alienvault-reconfig

The command reconfigures the whole system, to ensure that the plugin is properly used.

Once done, you can do the following:

Cat /var/log/alienvault/agent/agent.log | grep 10000

Now finally you might be able to see something like

Apr  4 11:30:18 VirtualUSMAllInOne ossim-agent: Alienvault-Agent[INFO]: Plugin[10000] Total lines [138] TotalEvents:[22]  EPS: [0.00] elapsed [10.01] seconds

Which means out of 138 lines in the log, Alienvault was able to parse 22 into events. Which makes sense since you only set up one policy – Unsuccessful Logins.

The best practice is simply to have a generic ‘Catch All’ policy at the end of the plugin which is extremely general and will catch everything else. With the methods in the previous article, hopefully you will be able to grasp this cryptic skill of plugins creation. Go ahead and try it.

If you head over to GUI, Go to Configuration->Threat Intelligence->Data Source->Data Source Groups.

Now create a new group and call it ‘EVERYTHINGISAWESOME’. Or something you like.

Now, lets add Data Source. Select the new data source you created, 10000.

Now head to Analysis->SIEM.

Filter Data Source Groups to the group you just created.

AWESOME! You can see UNSUCCESSFUL LOGIN and finally there is a source and destination IP and no longer 0.0.0.0

Go ahead and click on it and feel the warm, fuzzy feeling of success flow over you.

There’s one last thing you will need to do before we wrap this up in a ribbon.

Custom Directives.

You see, at the end, all the stuff you see in SIEM is useful only if you are eyeballing it. And in general, most people would rather eyeball the latest episode of the Walking Dead as opposed to eyeballing a SIEM. Heck, some people I know would rather eyeball a tulip growing than watching logs in a SIEM. That’s where Alarms come in. Alienvault has a very simple philosophy on alarms: if the Priority of the event, the Asset Value and the Reliability of that event is high enough, we are gonna throw out an Alarm. An Alarm is something that you should be somewhat…alarmed about.

So back to our unsuccessful login. In theory, if someone did one unsuccessful login, you would chalk it up to a typo. Two in a row, within 1 seconds, well, maybe he’s in a hurry. 5 in a row within 5 seconds, he’s going to look suspicious, but hey, he could be someone from senior management. Or the marketing director who thinks the DVD drive is a cupholder. 10 in a row within 10 seconds? OK, I’m just going to throw up an alarm and let the security guys know about this fellow.

How does it work?

Without going into too much intricacies of the Alienvault engine, it’s basically down to directives. And after wading through the swamp called custom plugins, you will find this a lot easier as it’s mostly done on the GUI.

First of all, obviously, make sure your custom plugin works.

Then, head to Configuration->Threat Intelligence and click on Directives.

You will see ‘User Contributed’ as empty. You can either create one from scratch or clone an existing one. I recommend the latter. Alienvault ships with around 2,000 directives in built and I would just feel bad to neglect the existing ones….I am sure the Alienvault engineers will be happier if you used theirs. They worked hard on these directives.

OK – for this case, I specifically want to know if someone is trying to bruteforce my extremely sensitive FTP server (I know, you are asking why I am using FTP and not SFTP, and my answer is: ILLUSTRATION.). So the first thing I do is, look, there is a convenient directive group called ‘Bruteforce Attack’. You already have over a hundred directives drawn out for you. Click on it.

Take your pick in any of the directives shown. For me, I chose

AV Bruteforce attack, FTP authentication attack against DST_IP 

Click on the “Clone” icon next to it.

You will find there’s one directive now under ‘User Contributed’.

You need to modify it somewhat.

AVDirective

A brief understanding will be useful here. This directive is basically saying:

a) If there is ONE occurrence of unsuccessful login from any IP to any destination that uses this data source, set the reliability to 4. Now, depending on your priority (usually it’s 3) and your asset value (usually it’s 2), this won’t throw an Alarm. The alarm works by

(Reliability X Priority X Asset Value) >= 25

So if you set your asset value as 5, then even one single wrong login will light up your Alarm panel.

b) So back to the rule – if there is 3 occurences of wrong login from the same source and same destination, we are going to raise the reliability up a little. But notice the timeout value – The timeout value defines how many seconds the plugin will wait to receive a response from the destination to which the request was sent. So if we don’t get a response within the timeout period the rule expires and the directive process defined in the rule is discarded.

c) Change the data source to the one that you created, in this case IIS_FTP and in the popup, select UNSUCCESSFUL LOGINS (in our case, the SID is 1). Everything else, we just took it from the original directive.

d) Restart the server. This doesn’t actually restart the whole Alienvault, just the correlation machine, so don’t worry that your SIEM is going to go down.

The final test is to just try to login into your FTP server with wrong passwords repeatedly.

Now head over to your Analysis->Alarms

You will see

AV Bruteforce attack, IIS FTP authentication attack against Host-192-168-0-35

Click on the details and scroll down and you will see the corresponding events and the correlation level of each event. You will see right at the bottom, after the first four attempts, an alarm was raised and the correlation level was raised. Then it goes through the next set of rules – after 10 attempts again, an alarm was raised and correlation level was raised.

Using policies (not covered here, else this article will be the size of War and Peace) – we can then decide what we want to do with this alarm – open a ticket, execute a script, send an email or trigger an SMS etc.

That’s about it. So we’ve covered getting NXLog all the way to Alienvault, Alienvault interpreting it through a plugin you created, and then using these new custom events to trigger an alarm using a directive you modified.

Welcome to the Alien Nation!

Alienvault with NXLog Part 2

AVNXLog

So, you have now figure out to enable Syslog over TCP on Alienvault. As it turns out, it’s optional in a sense you can get NXlog to run UDP. But it’s good to know.

Now in general, we don’t mess around with other systems other than Alienvault. But in reality, over so many POCs and deployment, its invariable that we will need to get our hands dirty and figure out with the client what on earth is happening and why don’t we see those dratted logs coming in. In the previous post, we’ve explored the useful tcpdump and the netstat – tulpen commands. But for this one, let’s look at the other side: NXlog and see how we set it up.

First of all, we obviously want to get something going in that windows box. Let’s say for instance, we set up FTP IIS there and we want to shovel all those logs over to AV. Now, I will assume FTP IIS is already up and logging is already done there, else we are going to be stuck talking about all sort of stuff that a million other articles have already explored.

We will jump into NXLog. Install NXLog (again, not going to explore that here), and once its up and running, we have set up the conf as follows

define ROOT C:\Program Files (x86)\nxlog
Moduledir %ROOT%\modules
CacheDir %ROOT%\data
Pidfile %ROOT%\data\nxlog.pid
SpoolDir %ROOT%\data
LogFile %ROOT%\data\nxlog.log
#Where your logs are
define IIS_LOGS C:\inetpub\logs\FTPSVC2
<Extension syslog>
 Module xm_syslog
</Extension>
#Define IIS Source
<Input IIS>
Module im_file
File "%IIS_LOGS%\u*"
SavePos TRUE
#Add in Syslog Fields
Exec $SourceName = 'IIS';
Exec $ProcessID = '1';
Exec $MessageID = '2';
#Don't send comments over
Exec if $raw_event =~ /^#/ drop();
#csv->parse_csv();
</Input>
#Define Output
<Output AV_Syslog>
Module om_udp
Host <Host of Alienvault>
Port 514
OutputType LineBased
Exec to_syslog_ietf();
</Output>
#Make something happen
<Route IIS>
Path IIS => AV_Syslog
</Route>

A few things are happening here, but basically you are getting NXLog to look into the specific folder for a file starting with u* and send it via UDP syslog to the Alienvault. Restart the NXLog and see if it works.

You should be seeing something on the tcpdump in Alienvault.

For starters, make sure your logfile is getting logs. Easiest way is to fire up an FTP client and just put or get into your FTP server and see if you see the logs ON THE SERVER first. If it’s there, then its a good start. You should be seeing some traffic hitting your Alienvault via the TCPDump.

Now for Alienvault, I know a lot of documentation out there teaches you to set up rsyslog manually and all, but with the new versions, they have simplified it. What we did was to go to the actual asset on the GUI: Assets and Groups -> Asset IP -> Details -> Plugins

Edit the Plugins and select Syslog

Most of us will go huh? Will this work?

No, it won’t work. Not yet anyway, but once this is done, you get two things:

Back in AV CLI, run

more /etc/ossim/agent/config.yml

The config.yml shows that for that particular device, it’s tied to which log file on the AV. Very useful especially if you have hundreds of logs coming in and you get confused.

/var/log/alienvault/devices

You should see a folder with the IP of the server you have NXLog running on and in that folder, a nice log file, which in turn will have the details of the logs that NXLog is sending over.

The problem now, is that AV doesn’t quite understand this log. Not yet. That’s where plugins come in play. We used the syslog plugin only as a placeholder to create the logfile. The syslog plugin won’t understand it.

Wait till you see a few lines coming into your Alienvault log file from the NXLog.

/var/log/alienvault/agent -> cat agent | grep 4007

What you have done here is to see if syslog plugin (Plugin id is 4007) can see anything coming in. It does, you might see some events like

Apr 2 11:27:25 VirtualUSMAllInOne ossim-agent: Alienvault-Agent[INFO]: Plugin[4007] Reading from /var/log/alienvault/devices/192.168.0.35/192.168.0.35.log
Apr 2 12:17:02 VirtualUSMAllInOne ossim-agent: Alienvault-Agent[INFO]: Plugin[4007] Total lines [134] TotalEvents:[134] EPS: [5.80] elapsed [10.01] seconds
Apr 2 12:17:12 VirtualUSMAllInOne ossim-agent: Alienvault-Agent[INFO]: Plugin[4007] Total lines [134] TotalEvents:[134] EPS: [0.00] elapsed [10.01] seconds

It basically means Alienvault processed x number of lines as ‘events’. Which you might think is great, but not so.

Back in the GUI SIEM, you can filter the datasource by ‘syslog’ and you will get a bunch of syslogs but with the destination and source host as 0.0.0.0. Basically this means, AV sees stuff coming, it uses syslog plugin to attempt to read the log but couldn’t figure out the IPs within that log due to its format and just sends out this cryptic line. Going into the event itself will give you a clue – the raw logs does state it is an FTP log coming from the FTP server, through NXLog. This means that Alienvault sees the logs, but using the syslog plugin, couldn’t interpret it properly due to its format.

So. You are half way there. The logs are coming in from a windows box through NXLog, and Alienvault sees it, but needs to speak the same language to understand it. Enter custom plugins.

Stay tuned!


« Older posts Newer posts »

© 2024 PKF AvantEdge

Up ↑